Deprecation Note
We published the last version of Graylog Documentation before the release of Graylog 4.2. Now, all documentation and help content for Graylog products are available at https://docs.graylog.org/.
There will be no further updates to these pages as of October 2021.
Do you have questions about our documentation? You may place comments or start discussions about documentation here: https://community.graylog.org/c/documentation-campfire/30
Streams
What are streams?
The Graylog streams are a mechanism to route messages into categories in realtime while they are processed. You define rules that instruct Graylog which message to route into which streams. Imagine sending these three messages to Graylog:
message: INSERT failed (out of disk space)
level: 3 (error)
source: database-host-1

message: Added user 'foo'.
level: 6 (informational)
source: database-host-2

message: smtp ERR: remote closed the connection
level: 3 (error)
source: application-x
One of the many things that you could do with streams is creating a stream called Database errors that is catching every error message from one of your database hosts.
Create a new stream with these rules, selecting the option to match all rules:
Field
levelmust be greater than4Field
sourcemust match regular expression^database-host-\d+
This will route every new message with a level higher than WARN and a source that matches the database host regular
expression into the stream.
A message will be routed into every stream that has all (or any) of its rules matching. This means that a message can be part of many streams and not just one.
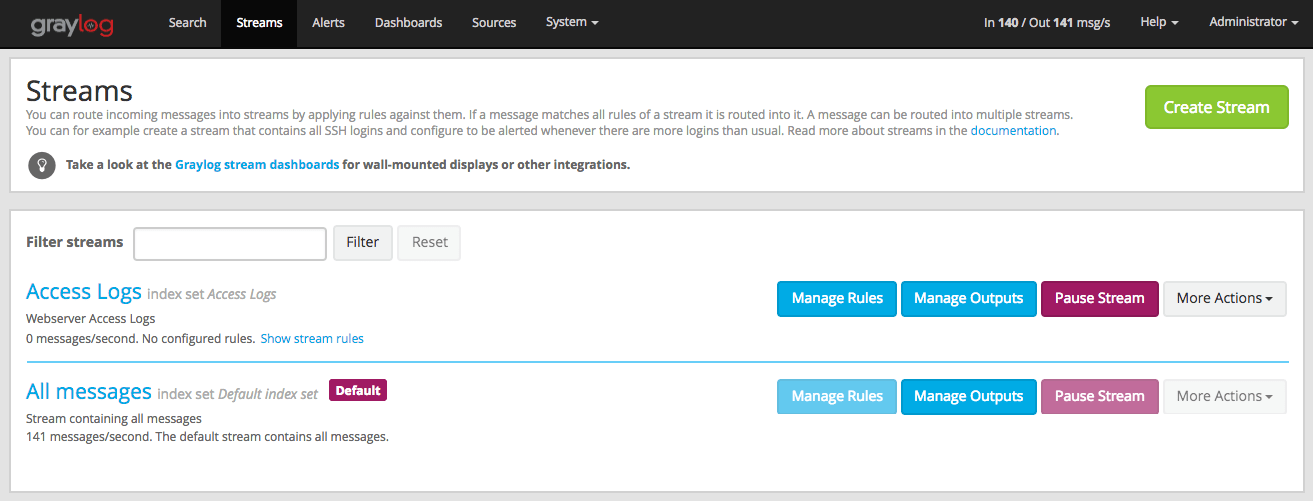
The stream is now appearing in the streams list and a click on its title will show you all database errors.
Streams can be used to be alerted in case certain condition happens. We cover more topics related to alerts in Alerts.
What’s the difference to saved searches?
The biggest difference is that streams are processed in realtime. This allows realtime alerting and forwarding to other systems. Imagine forwarding your database errors to another system or writing them to a file by regularly reading them from the message storage. Realtime streams do this much better.
Another difference is that searches for complex stream rule sets are always comparably cheap to perform because a message is tagged with stream IDs when processed. A search for Graylog internally always looks like this, no matter how many stream rules you have configured:
streams:[STREAM_ID]
Building a query with all rules would cause significantly higher load on the message storage.
How do I create a stream?
Navigate to the streams section from the top navigation bar.
Click “Create stream”.
Save the stream after entering a name and a description. For example All error messages and Catching all error messages from all sources. The stream is now saved but not yet activated.
Click on “Edit rules” for the stream you just created. That will open a page where you can manage and test stream rules.
Choose how you want to evaluate the stream rules to decide which messages go into the stream:
A message must match all of the following rules (logical AND): Messages will only be routed into the stream if all rules in the stream are fulfilled. This is the default behavior
A message must match at least one of the following rules (logical OR): Messages will be routed into the stream if one or more rules in the stream are fulfilled
Add stream rules, by indicating the field that you want to check, and the condition that should satisfy. Try the rules against some messages by loading them from an input or manually giving a message ID. Once you are satisfied with the results, click on “I’m done”.
The stream is still paused, click on the “Start stream” button to activate the stream.
Index Sets
For starters, you should read Index model for a comprehensive description of the index set functionality in Graylog.
Every stream is assigned to an index set which controls how messages routed into that stream are being stored into Elasticsearch. The stream overview in the web interface shows the assigned index set for each stream.
Index sets can be assigned to a stream when creating the stream and changed later when editing the stream settings.
Important
Graylog will not automatically copy messages into new Elasticsearch indices if another index set is being assigned to a stream.
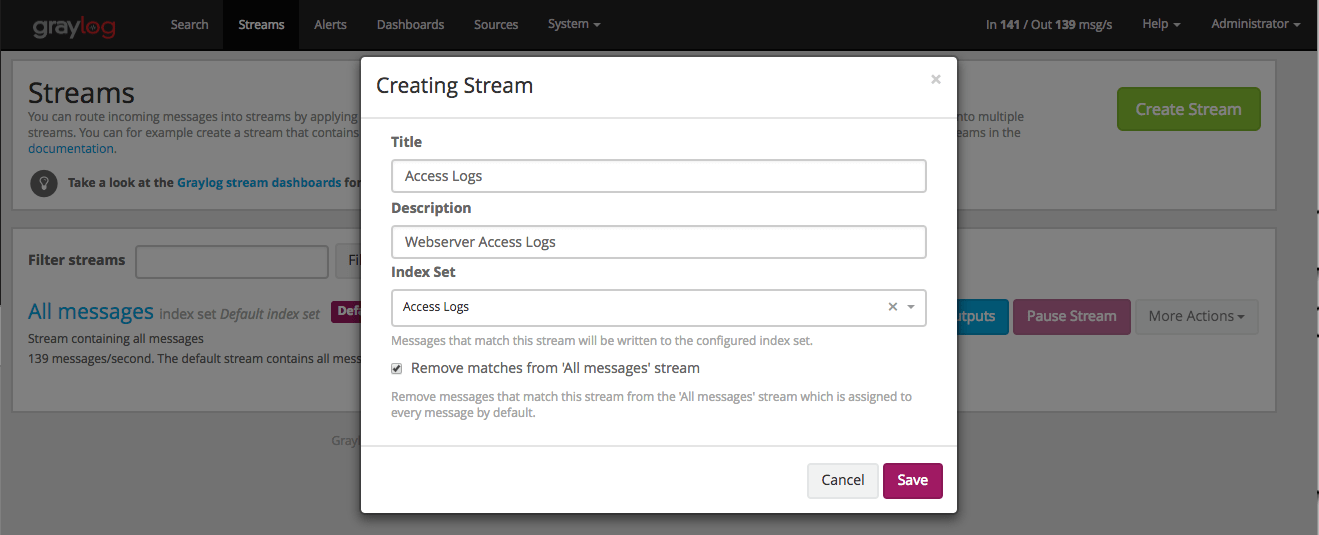
Graylog routes every message into the All messages stream by default, unless the message is removed from this stream with a pipeline rule (see Processing Pipelines) or it’s routed into a stream marked with Remove matches from ‘All messages’ stream.
The latter is useful if messages should be stored with different settings than the ones in the Default index set, for example web server access logs should only be stored for 4 weeks while all other messages should be stored for 1 year.
Storage requirements
Graylog writes messages once for each index set into Elasticsearch. This means that if all streams are using the Default index set, each message will be written exactly once into Elasticsearch, no matter into how many streams the message has been sent. This can be thought of a kind of de-duplication.
If some streams use other index sets and the Remove matches from ‘All messages’ stream setting is not enabled, messages will be written into Elasticsearch at least twice, once for the Default index set and once for the assigned index set. This means that the same message will be stored in two or more indices in Elasticsearch with different index settings.
Unless you explicitly want to store messages multiple times in different Elasticsearch indices, either assign the Default index set to the respective streams or enable the Remove matches from ‘All messages’ stream setting for the respective streams.
Outputs
The stream output system allows you to forward every message that is routed into a stream to other destinations.
Outputs are managed globally (like message inputs) and not for single streams. You can create new outputs and activate them for as many streams as you like. This way you can configure a forwarding destination once and select multiple streams to use it.
Graylog ships with default outputs and can be extended with Plugins.
Use cases
These are a few example use cases for streams:
Forward a subset of messages to other data analysis or BI systems to reduce their license costs.
Monitor exception or error rates in your whole environment and broken down per subsystem.
Get a list of all failed SSH logins and use aggregate on the username field to analyze which user names where affected.
Catch all HTTP POST requests to
/loginthat were answered with a HTTP 302 and route them into a stream called Successful user logins. Now get a chart of when users logged in and use quick values to get a list of users that performed the most logins in the search time frame.
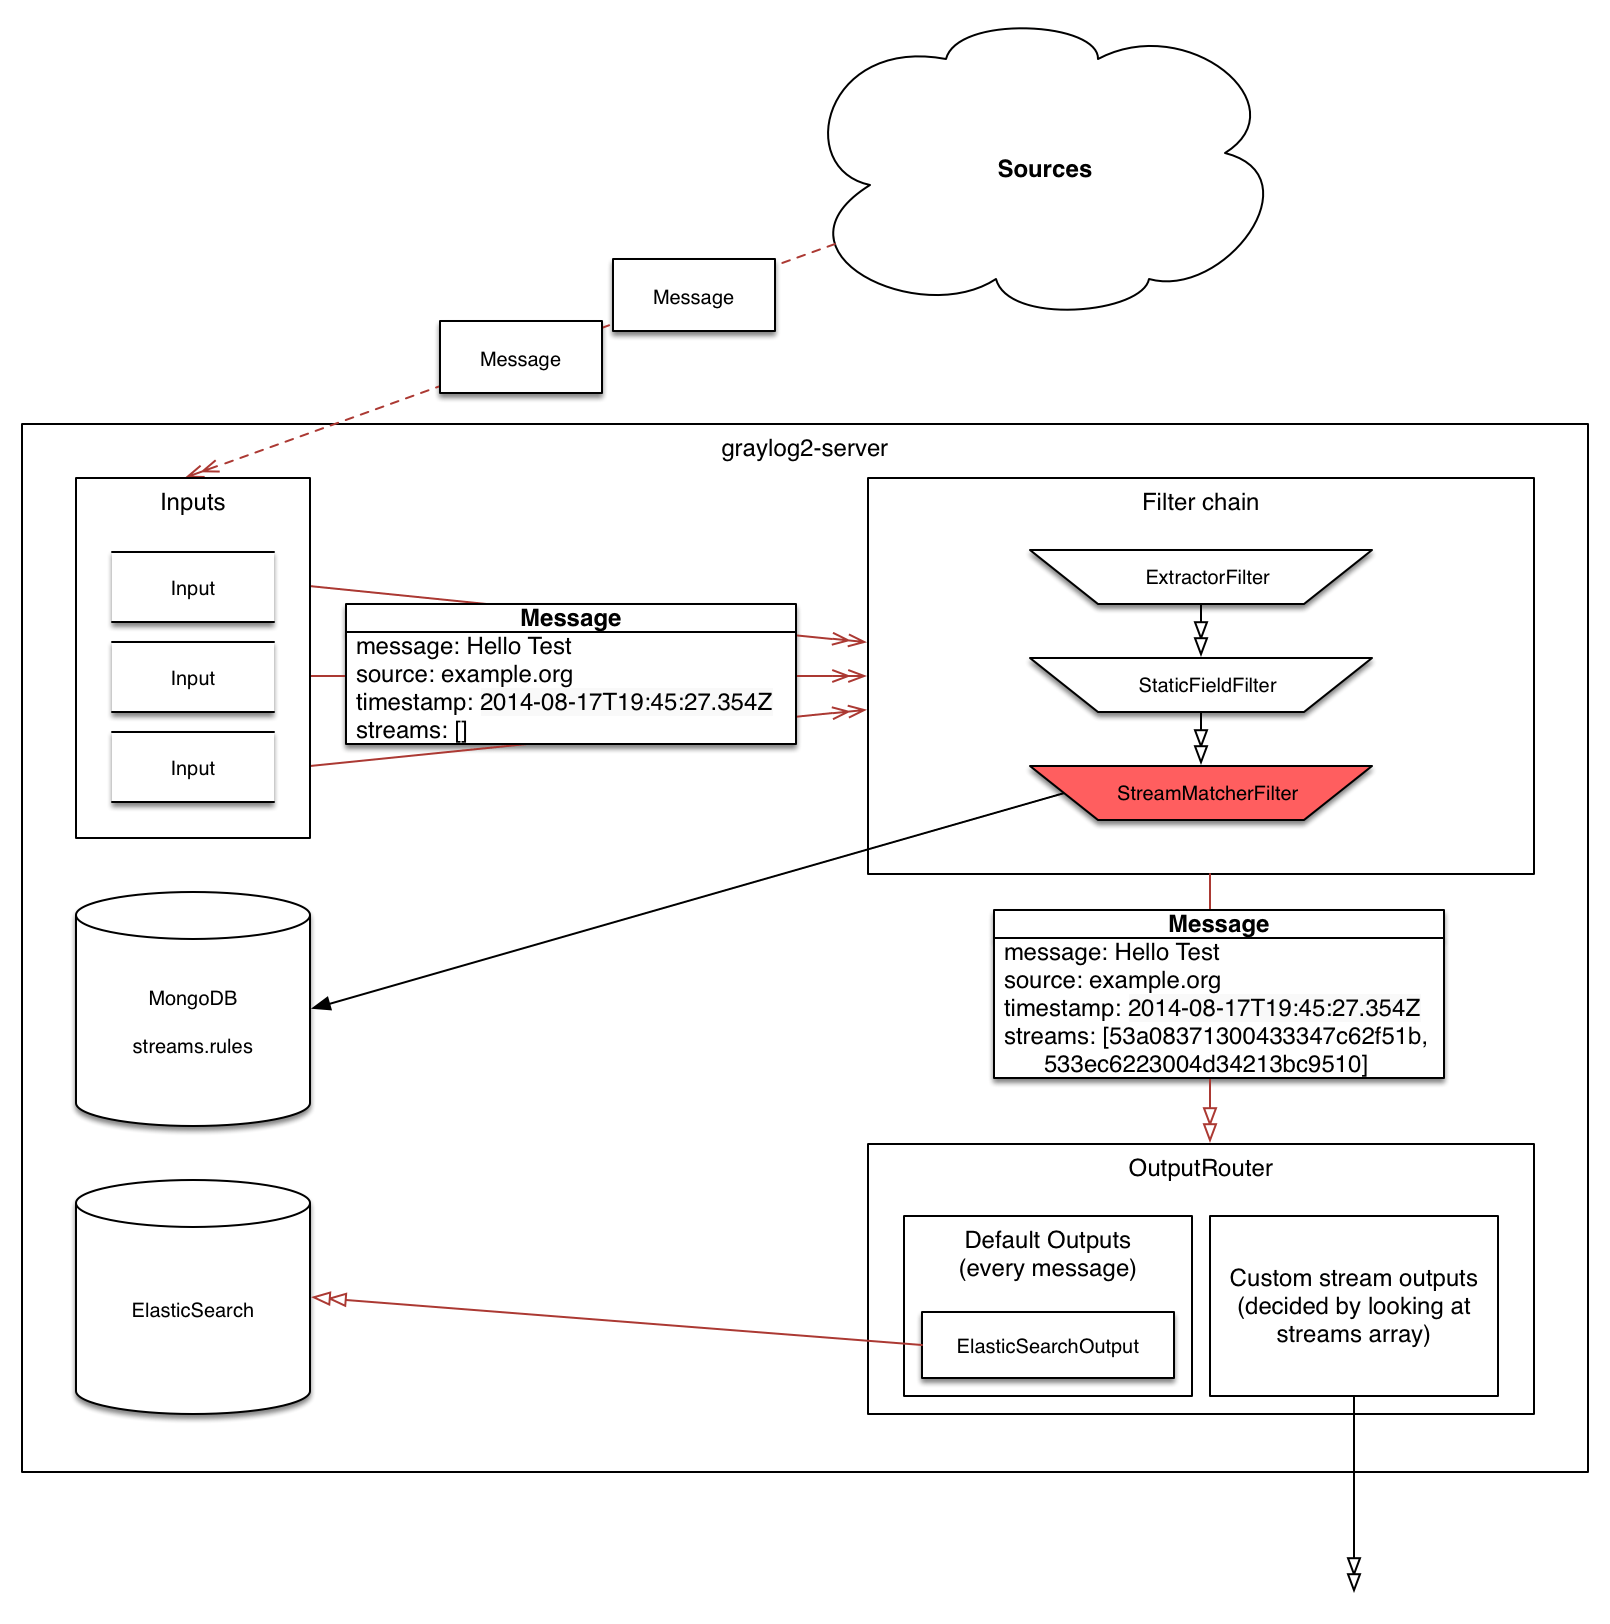
How are streams processed internally?
Every message that comes in is matched against the rules of a stream. For messages satisfying all or
at least one of the stream rules (as configured in the stream), the internal ID of that stream is stored
in the streams array of the processed message.
All analysis methods and searches that are bound to streams can now easily narrow their operation by searching with a
streams:[STREAM_ID] limit. This is done automatically by Graylog and does not have to be provided by the user.
Stream Processing Runtime Limits
An important step during the processing of a message is the stream classification. Every message is matched against the user-configured stream rules. The message is added to the stream if all or any rules of a stream matches, depending on what the user chose. Applying stream rules is done during the indexing of a message only, so the amount of time spent for the classification of a message is crucial for the overall performance and message throughput the system can handle.
There are certain scenarios when a stream rule takes very long to match. When this happens for a number of messages, message processing can stall, messages waiting for processing accumulate in memory and the whole system could become non-responsive. Messages are lost and manual intervention would be necessary. This is the worst case scenario.
To prevent this, the runtime of stream rule matching is limited. When it is taking longer than the configured runtime limit, the process of matching this exact message against the rules of this specific stream is aborted. Message processing in general and for this specific message continues though. As the runtime limit needs to be configured pretty high (usually a magnitude higher as a regular stream rule match takes), any excess of it is considered a fault and is recorded for this stream. If the number of recorded faults for a single stream is higher than a configured threshold, the stream rule set of this stream is considered faulty and the stream is disabled. This is done to protect the overall stability and performance of message processing. Obviously, this is a tradeoff and based on the assumption, that the total loss of one or more messages is worse than a loss of stream classification for these.
There are scenarios where this might not be applicable or even detrimental. If there is a high fluctuation of the message load including situations where the message load is much higher than the system can handle, overall stream matching can take longer than the configured timeout. If this happens repeatedly, all streams get disabled. This is a clear indicator that your system is overutilized and not able to handle the peak message load.
How to configure the timeout values if the defaults do not match
There are two configuration variables in the configuration file of the server, which influence the behavior of this functionality.
stream_processing_timeoutdefines the maximum amount of time the rules of a stream are able to spend. When this is exceeded, stream rule matching for this stream is aborted and a fault is recorded. This setting is defined in milliseconds, the default is2000(2 seconds).stream_processing_max_faultsis the maximum number of times a single stream can exceed this runtime limit. When it happens more often, the stream is disabled until it is manually reenabled. The default for this setting is3.
What could cause it?
If a single stream has been disabled and all others are doing well, the chances are high that one or more stream rules are performing bad under certain circumstances. In most cases, this is related to stream rules which are utilizing regular expressions. For most other stream rules types the general runtime is constant, while it varies very much for regular expressions, influenced by the regular expression itself and the input matched against it. In some special cases, the difference between a match and a non-match of a regular expression can be in the order of 100 or even 1000. This is caused by a phenomenon called catastrophic backtracking. There are good write-ups about it on the web which will help you understanding it.
Summary: How do I solve it?
Check the rules of the stream that is disabled for rules that could take very long (especially regular expressions).
Modify or delete those stream rules.
Re-enable the stream.
Programmatic access via the REST API
Many organisations already run monitoring infrastructure that are able to alert operations staff when incidents are detected. These systems are often capable of either polling for information on a regular schedule or being pushed new alerts - this article describes how to use the Graylog Stream Alert API to poll for currently active alerts in order to further process them in third party products.
Checking for currently active alert/triggered conditions
Graylog stream alerts can currently be configured to send emails when one or more of the associated alert conditions evaluate to true. While sending email solves many immediate problems when it comes to alerting, it can be helpful to gain programmatic access to the currently active alerts.
Each stream which has alerts configured also has a list of active alerts, which can potentially be empty if there were no alerts so far. Using the stream’s ID, one can check the current state of the alert conditions associated with the stream using the authenticated API call:
GET /streams/<streamid>/alerts/check
It returns a description of the configured conditions as well as a count of how many triggered the alert. This data can be used to for example send SNMP traps in other parts of the monitoring system.
Sample JSON return value:
{
  "total_triggered": 0,
  "results": [
    {
      "condition": {
        "id": "984d04d5-1791-4500-a17e-cd9621cc2ea7",
        "in_grace": false,
        "created_at": "2014-06-11T12:42:50.312Z",
        "parameters": {
          "field": "one_minute_rate",
          "grace": 1,
          "time": 1,
          "backlog": 0,
          "threshold_type": "lower",
          "type": "mean",
          "threshold": 1
        },
        "creator_user_id": "admin",
        "type": "field_value"
      },
      "triggered": false
    }
  ],
  "calculated_at": "2014-06-12T13:44:20.704Z"
}
Note that the result is cached for 30 seconds.
List of already triggered stream alerts
Checking the current state of a stream’s alerts can be useful to trigger alarms in other monitoring systems, but if one wants to send more detailed messages to operations, it can be very helpful to get more information about the current state of the stream, for example the list of all triggered alerts since a certain timestamp.
This information is available per stream using the call:
GET /streams/<streamid>/alerts?since=1402460923
The since parameter is a unix timestamp value. Its return value could be:
{
  "total": 1,
  "alerts": [
    {
      "id": "539878473004e72240a5c829",
      "condition_id": "984d04d5-1791-4500-a17e-cd9621cc2ea7",
      "condition_parameters": {
        "field": "one_minute_rate",
        "grace": 1,
        "time": 1,
        "backlog": 0,
        "threshold_type": "lower",
        "type": "mean",
        "threshold": 1
      },
      "description": "Field one_minute_rate had a mean of 0.0 in the last 1 minutes with trigger condition lower than 1.0. (Current grace time: 1 minutes)",
      "triggered_at": "2014-06-11T15:39:51.780Z",
      "stream_id": "53984d8630042acb39c79f84"
    }
  ]
}
Using this information more detailed messages can be produced, since the response contains more detailed information about the nature of the alert, as well as the number of alerts triggered since the timestamp provided.
Note that currently a maximum of 300 alerts will be returned.
FAQs
Using regular expressions for stream matching
Stream rules support matching field values using regular expressions. Graylog uses the Java Pattern class to execute regular expressions.
For the individual elements of regular expression syntax, please refer to Oracle’s documentation, however the syntax largely follows the familiar regular expression languages in widespread use today and will be familiar to most.
However, one key question that is often raised is matching a string in case insensitive manner. Java regular expressions are case sensitive by default. Certain flags, such as the one to ignore case sensitivity can either be set in the code, or as an inline flag in the regular expression.
To for example route every message that matches the browser name in the following user agent string:
Mozilla/5.0 (Macintosh; Intel Mac OS X 10_9_1) AppleWebKit/537.36 (KHTML, like Gecko) Chrome/32.0.1700.107 Safari/537.36
the regular expression .*applewebkit.* will not match because it is case sensitive.
In order to match the expression using any combination of upper- and lowercase characters use the (?i) flag as such:
(?i).*applewebkit.*
Most of the other flags supported by Java are rarely used in the context of matching stream rules or extractors, but if you need them their use is documented on the same Javadoc page by Oracle.
Can I add messages to a stream after they were processed and stored?
No. Currently there is no way to re-process or re-match messages into streams.
Only new messages are routed into the current set of streams.