Deprecation Note
We published the last version of Graylog Documentation before the release of Graylog 4.2. Now, all documentation and help content for Graylog products are available at https://docs.graylog.org/.
There will be no further updates to these pages as of October 2021.
Do you have questions about our documentation? You may place comments or start discussions about documentation here: https://community.graylog.org/c/documentation-campfire/30
Alerting by Example
The goal of this document is to provide explanation for the configuration of an Event Definition with an real life example.
Scenario
Graylog is getting log messages for a service, where user needs to authenticate to log in to the service (e.g ssh, web app). In this scenario we want to receive an email from Graylog if a brute force attack is run on the authentication of the service. So if one user failed to login to a system 10 times in one minute than we want to get an email from Graylog.
Event Details
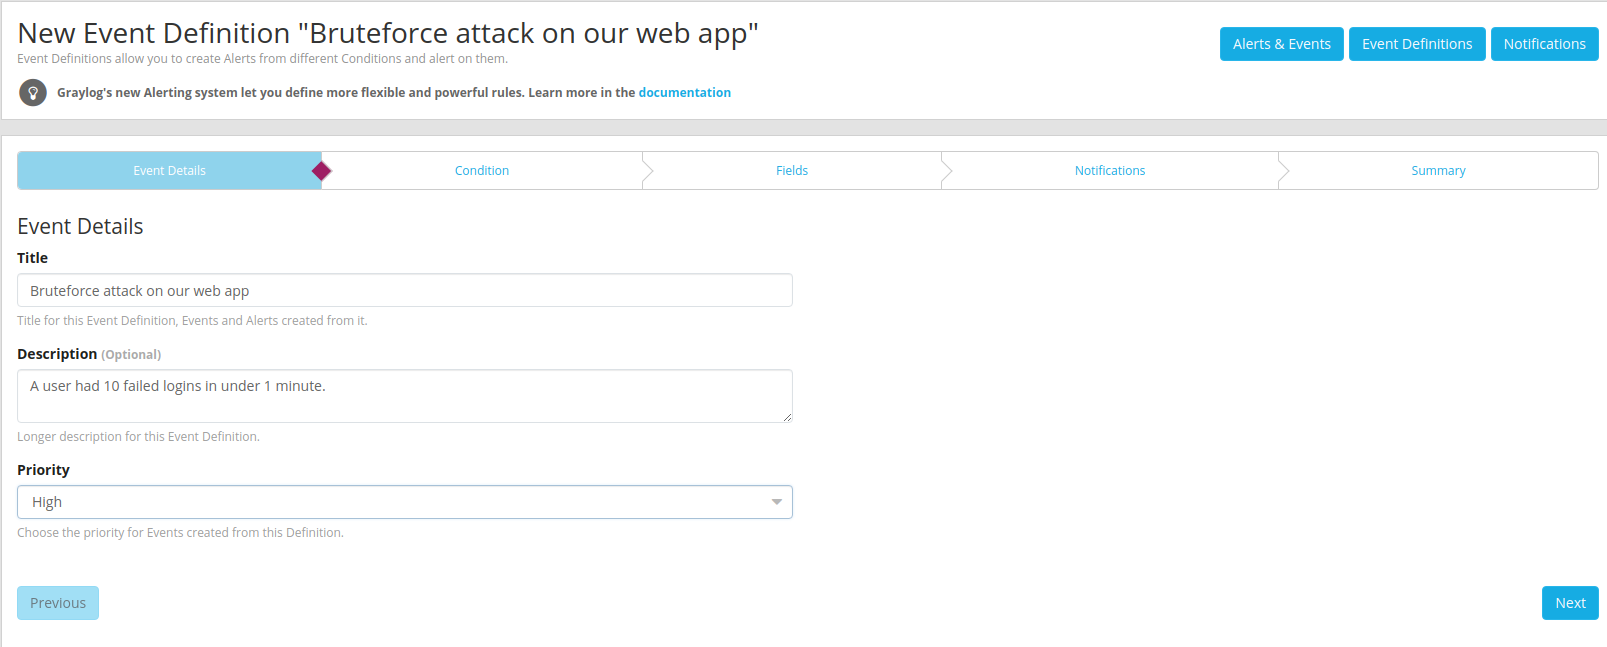
After clicking on Create Event Definition we see the Event Definition create wizard.
We are on the first page called Event Details.
Here we enter title and description of our Event Definition. Also we define a priority.
The priority is a tool for the user to add a classification to a event. It will be later
displayed in the events overview as a thermometer:

Since we get a message about a brute force attack which should be treated urgently we set
the priority on high and go on to the next step.
Condition
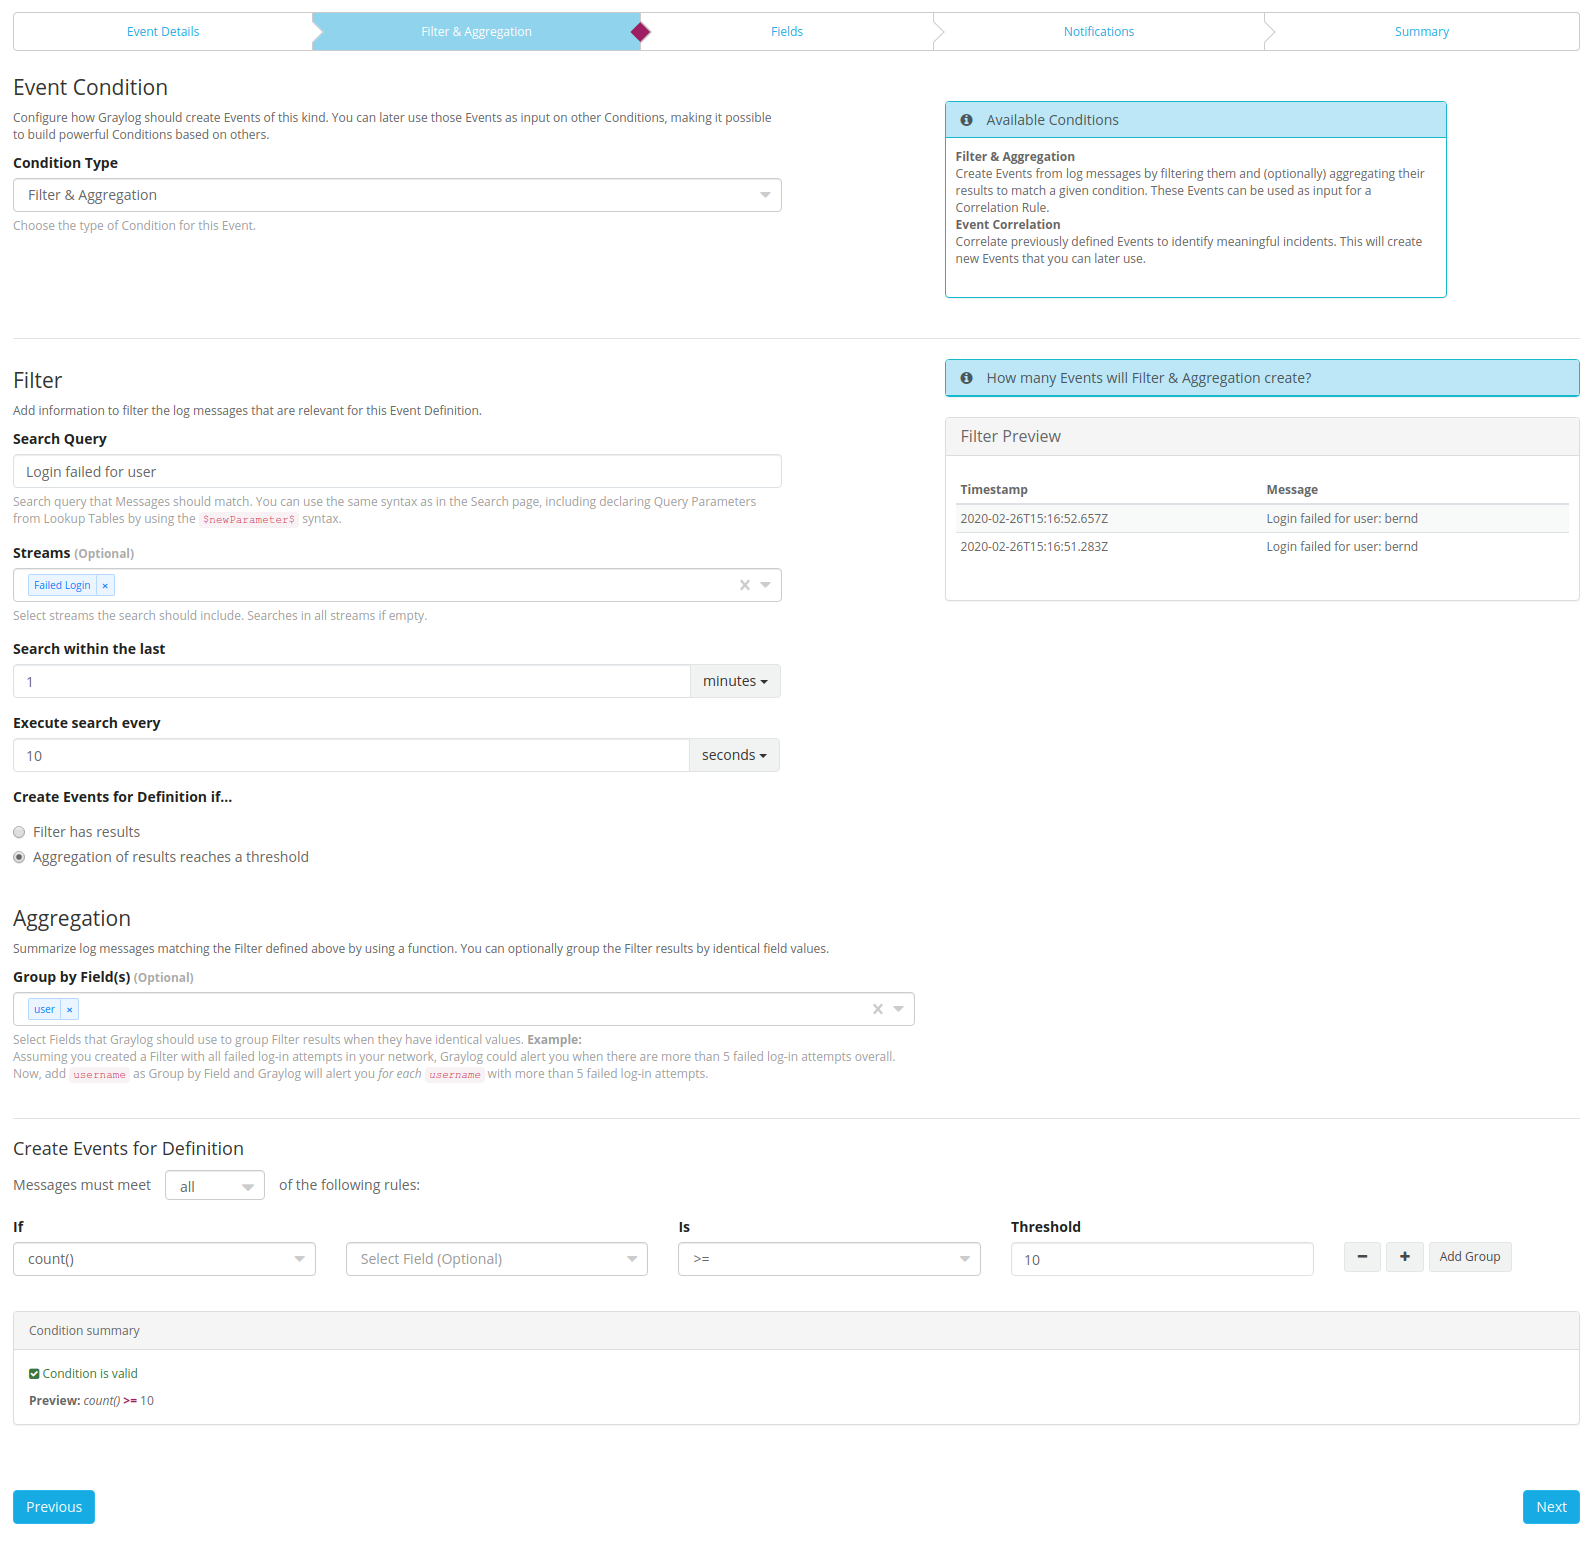
As Condition Type we choose Filter & Aggregation. Below the selection will now the
Filter section be available.
Filter
First of all we choose the Stream in which our log files are routed. If no stream for
the web application was created, we highly recommend to do that.
That way the query result will be limited to the logs of the web application and no other logs
can influence the filter process.
Now we need to filter the incoming messages so we can later count the messages which are matching the filter. The log message which is indicating a failed authentication look like this:
Login failed for user admin from ip 240.210.133.39
So we add "Login failed for user" to our query field. On the right side should
now a preview table appear which shows the messages matching the query.
The preview uses Search within the last as time range. If you provoke
a log entry now, you should see at least this message after updating the
query.
Now we set Search within the last to 10 seconds and Execute search every
to 10 seconds. Now the Event engine will execute the query every 10 seconds
for a time range of 10 seconds.
Warning
If Search within the last is greater than Execute search every
(which would be called a hopping window)
the event engine generate multiple events for the same log line. For example if you set
Search within the last to one minute and Execute search every to 10 seconds
the engine will find the same log entry 6 times. Since the log entry is visible for one
minute and we search every 10 seconds.
If the Search within the last is the same as the Execute search every period,
you create a so called Tumbling window which is recommended for most situations.
Aggregation
Since we want to aggregate on our events to count that we have more then 10
messages in 10 seconds, we choose Aggregation of results reaches a threshold
for Create Events for Definition if... and go on with aggregation.
To be able to count the failed login attempts per user, we need an
extractor on our incoming messages which is extracting our user
name and store it in a field called user. Now we can expect that every message
with login failed has a field user. And we use that field in the selection
Group by Field(s).
In the last step of that page we add one aggregation rule.
If count() is >= 10.
To summarize what we have done here:
We add a stream to minimize the messages we have to filter on.
Insert a query to filter the logs down to our failed logins.
Grouped our logs so the aggregation will be only applied per user.
Add a rule which states that we only raise an alert if the count more than or equals 10.
By hitting next we come to the Fields page of the wizard.
Fields
Here we can add a custom field to our event. These fields can be used for several things.
First of all it will be a field which is part of the event. So it will be displayed as a field on the search page. That also means you can again run aggregations on that field. Fields can also be accessed within a notification and can be used for the enterprise feature correlation.
Since we are using an aggregation event definition, the only accessible fields are the ones we configured
in the Group by Field(s). When aggregating multiple messages to one event we lose all fields
we do not make a group by on. We want to add the user key to our notification, which we
put in our Group by Field(s).
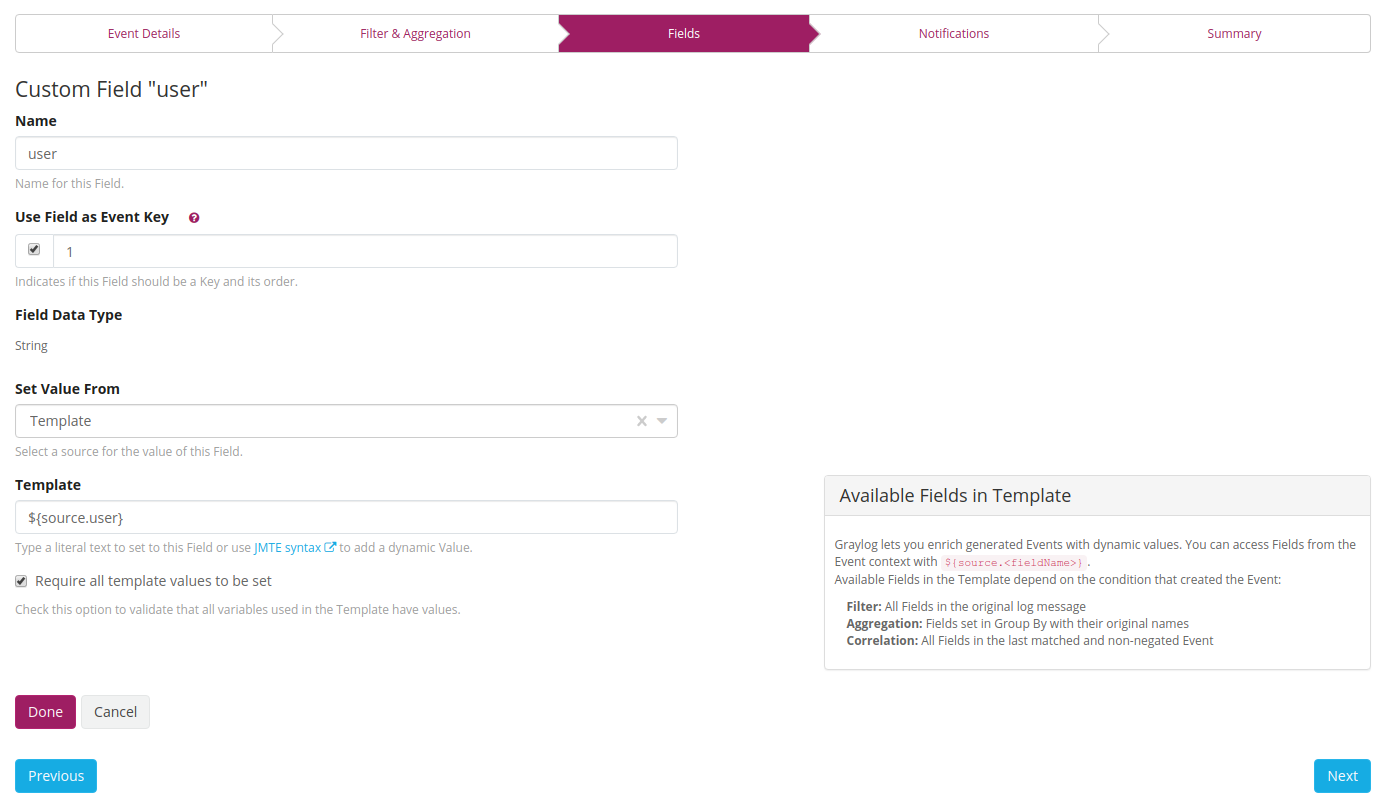
At first we add a Name for our key. This is also the reference for future use, like the field name of the event message, later to aggregate on. Then we set Use Field as Event Key to true. This means the notifications will be grouped by this key. This is important in the next step for the group key is considered in the grace period. The number is reflecting the order in the grouping. If we would add another key (like the IP address from which the user connects), then we would first group by user and then group by IP, entering 2 for the IP address here.
For Set Value From we choose the template. This will extract the field from the resulting aggregation
or filtered log message. Here we enter ${source.user}. The resulting aggregation will be the source
containing a field user since we entered it in the Group by Field(s).
If we only want events which do set the key - this is more important for filtered log messages -
then we could set the flag Require all template values to be set. But since we have aggregation,
this field is not needed and we go to the next page.
Notifications
We want to receive an email when the event got raised. Configuring a notification, will elevate the event to an alert.
How to setup an email notification is explained here.
We will therefore select our already defined email notification and set our Grace Period
to 5 Minutes. If we are target of a brute force attack then we do not want to get an email every
10 seconds reminding us that we are being attacked. This Grace Period will only be respected
per Event Key we selected in our custom fields. So we will get an email for every new user name
the attackers are using.
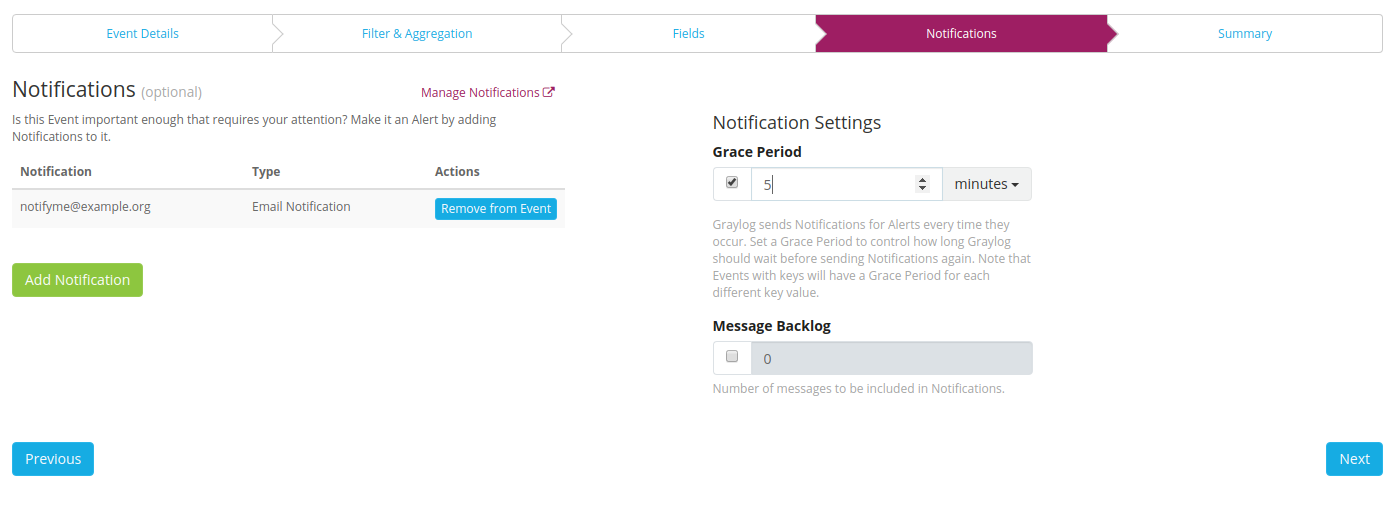
Since we use an aggregation event here, the message backlog might not be really helpful
so I leave it off.
The backlog will show all messages within the time range of Search within the last and
use the Query we entered. If you have a good enough query this can still be helpful.
The number input will limit the amount of messages in the backlog.
Summary
We go on to the summary to have a last look at our Event Definition.
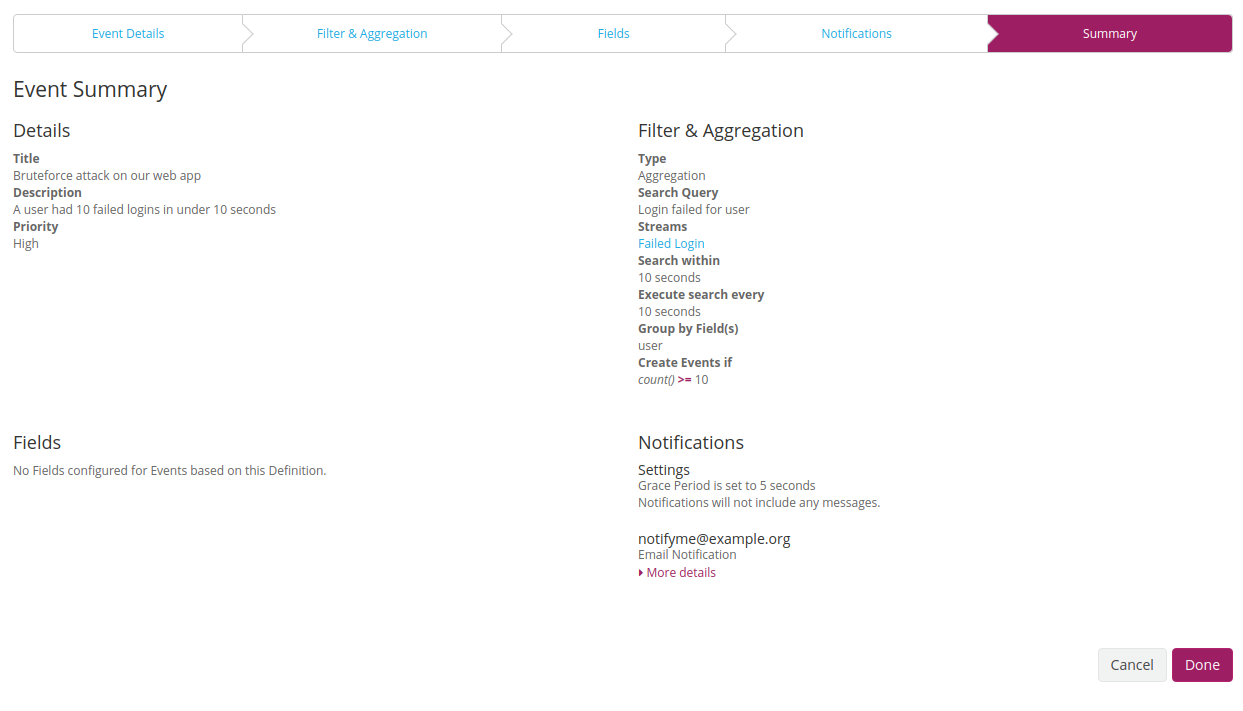
After checking that all our configuration is correct we click on done to save the Event Definition.
Working with the alerts
When a attacker now tries to login 10 times in under 10 seconds you should receive an email with content looking like this:
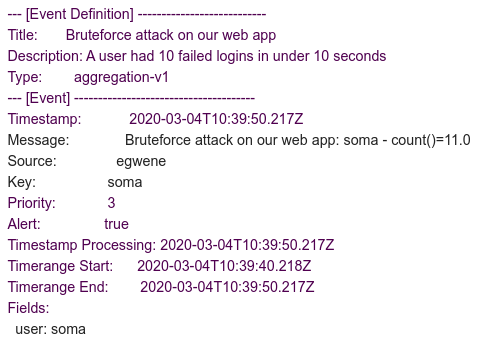
Here you can see that our user was set as key. Now we will go to the search page and create a widget
based on that.
First of all we select the All events stream to narrow down our messages to the events. Then we
add the event_definition_id to our query to only display the events of our new created event
definition. Then we create a new aggregation widget and select the timestamp field as our Rows, we
put key in our columns field and at last we set count() as our Metrics.
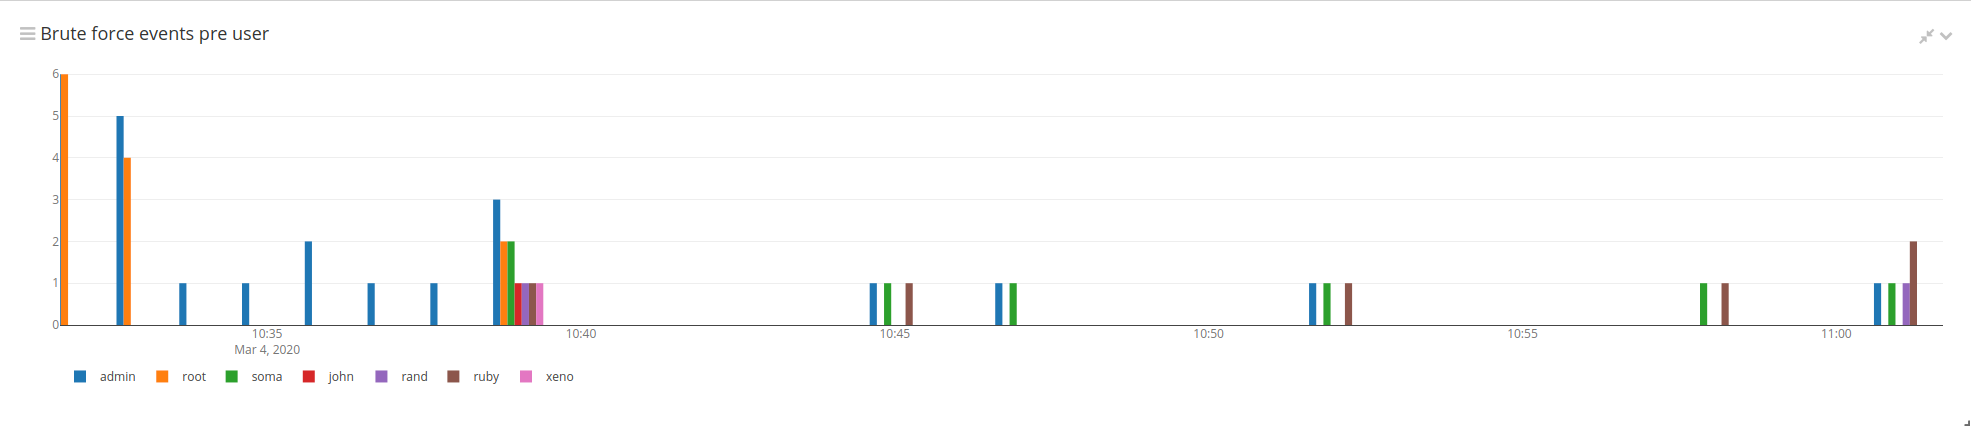
Now we can see the amount of alerts raised per user overtime. This is also helpful to be put into an report later on.