Deprecation Note
We published the last version of Graylog Documentation before the release of Graylog 4.2. Now, all documentation and help content for Graylog products are available at https://docs.graylog.org/.
There will be no further updates to these pages as of October 2021.
Do you have questions about our documentation? You may place comments or start discussions about documentation here: https://community.graylog.org/c/documentation-campfire/30
Widgets
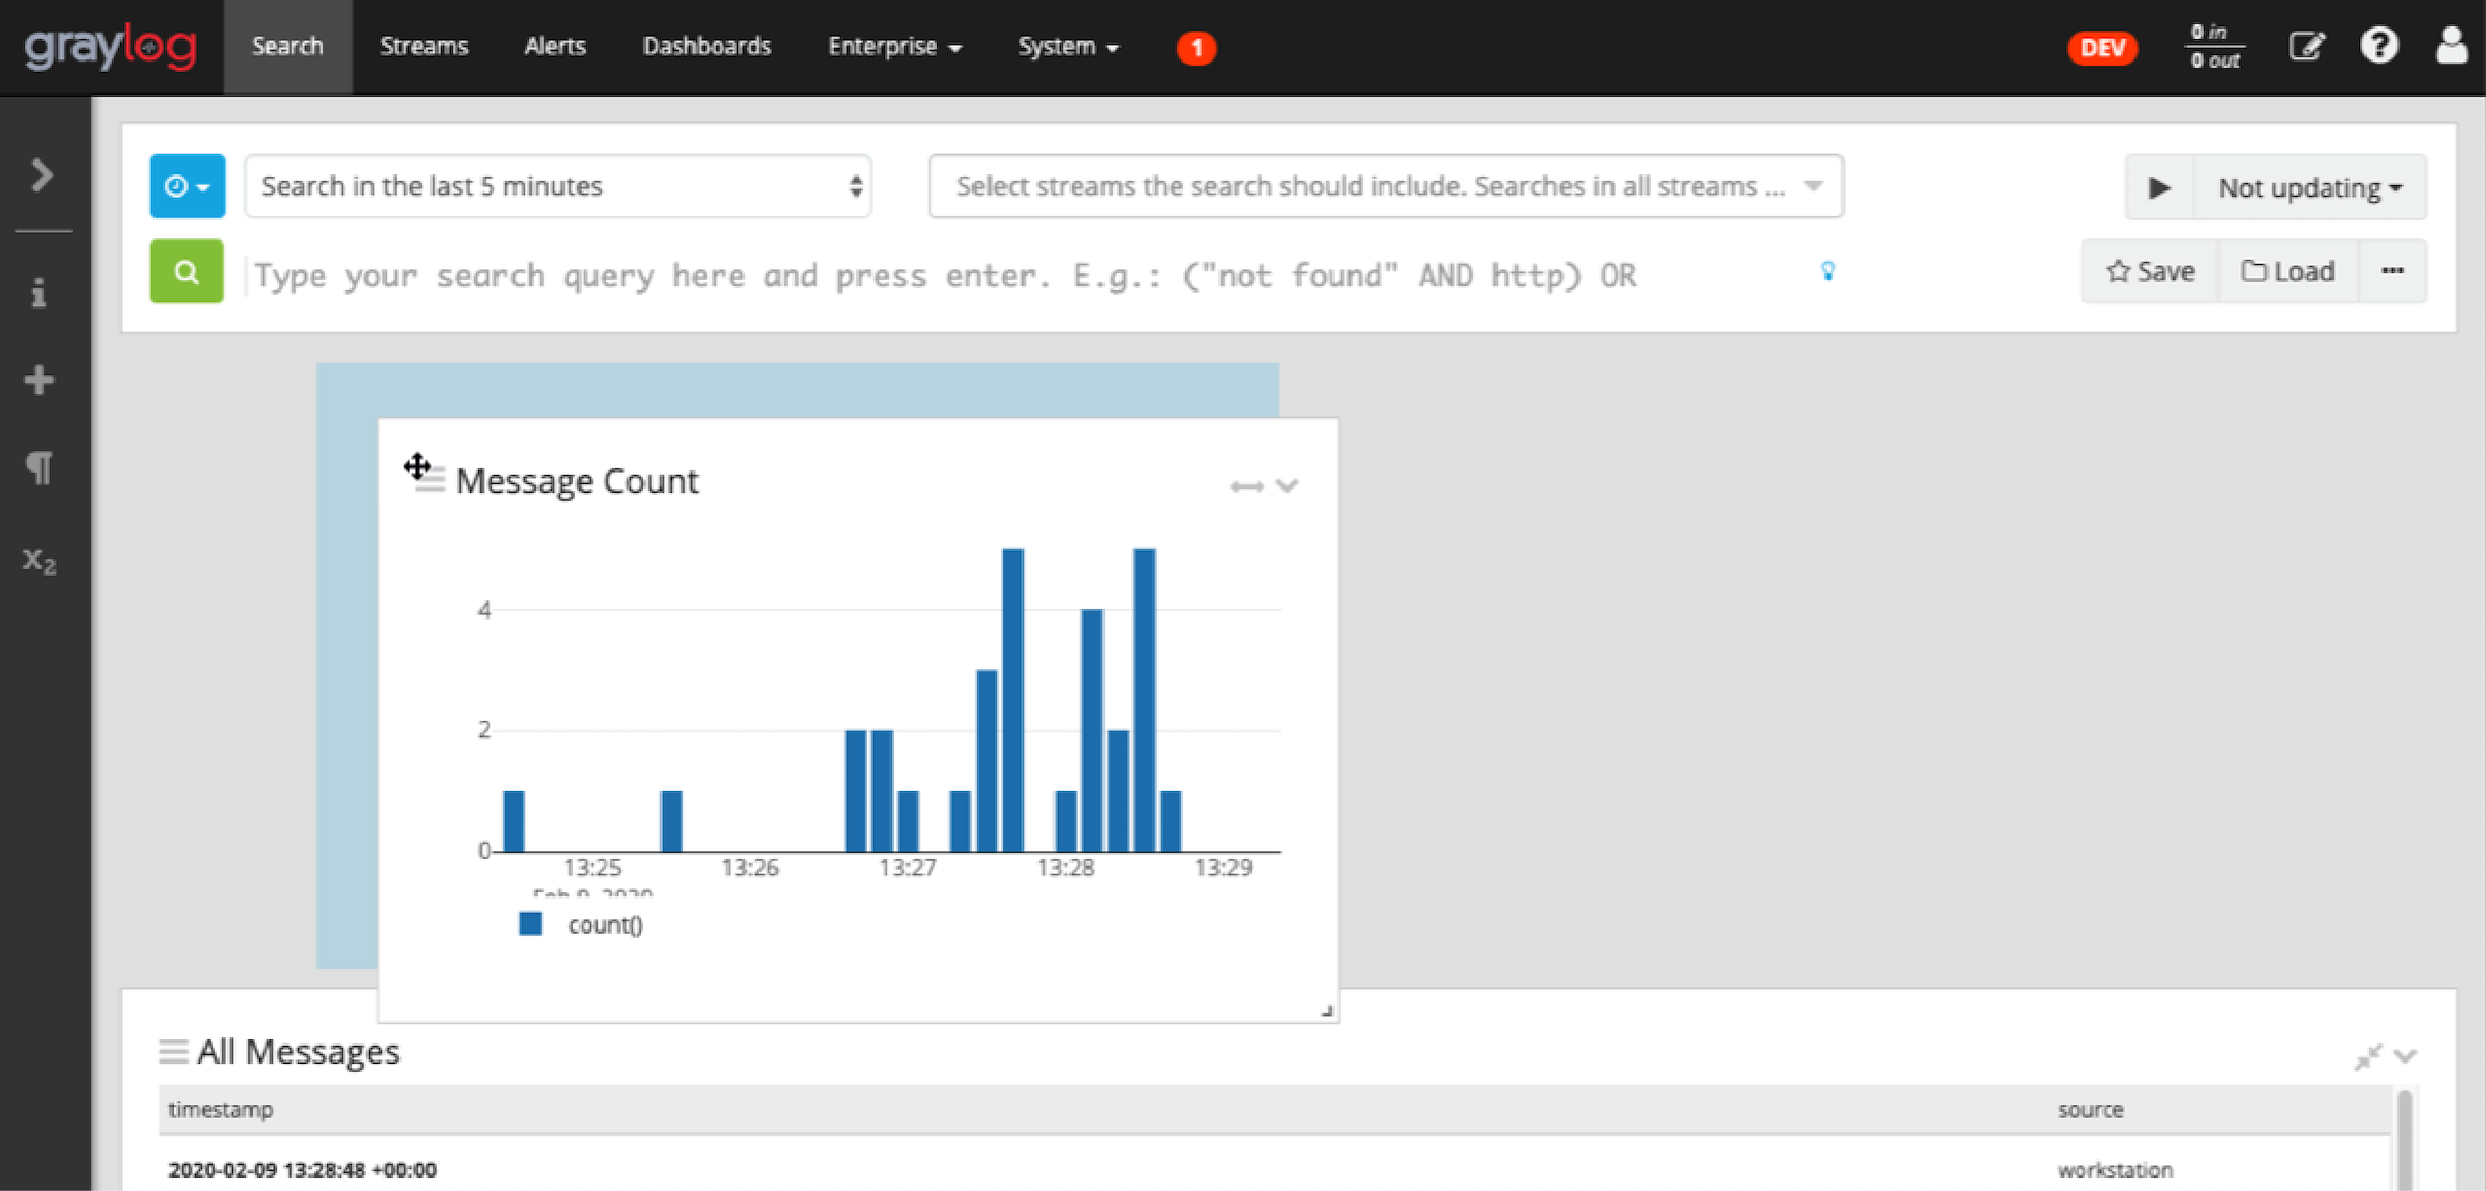
Graylog supports a wide variety of widgets which allow you to quickly visualize data from your logs. A widget is either a Message Table or an Aggregation. This section intends to give you some information to better understand each widget type, and how they can help you to see relevant details from the many logs you receive.
A widget can be freely placed inside a query. A widget can be edited or duplicated by clicking on the chevron on the right side in the head of the widget.
Creating a widget
To add a widget for your search or dashboard, open the sidebar and the “Create” section. You can also open the section directly by clicking on the plus sign.
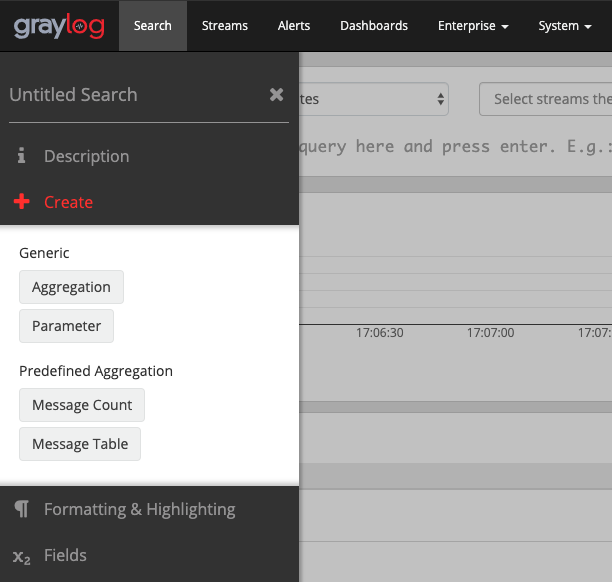
You can create an empty “Aggregation”. or a predefined widget by selecting the “Message Table” or “Message Count” .
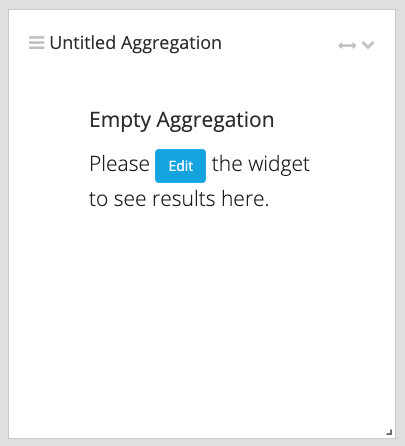
Empty aggregation widget:
Aggregation
The goal of an aggregation is to reduce the number of data points in a meaningful way to get an answer from them. Data points can be numeric field types in a message (e.g. a took_ms field which contains how long a page needed to be rendered). Or string values which can be used for grouping the aggregation (e.g an action field which contains the name of the controller action).
Configuring an aggregation
As describe in the previous section a click on + Create -> Aggreatation will create an empty widget on the very top of the search page. A click on the chevron icon -> Edit on the right side of the head will open the widget edit modal.
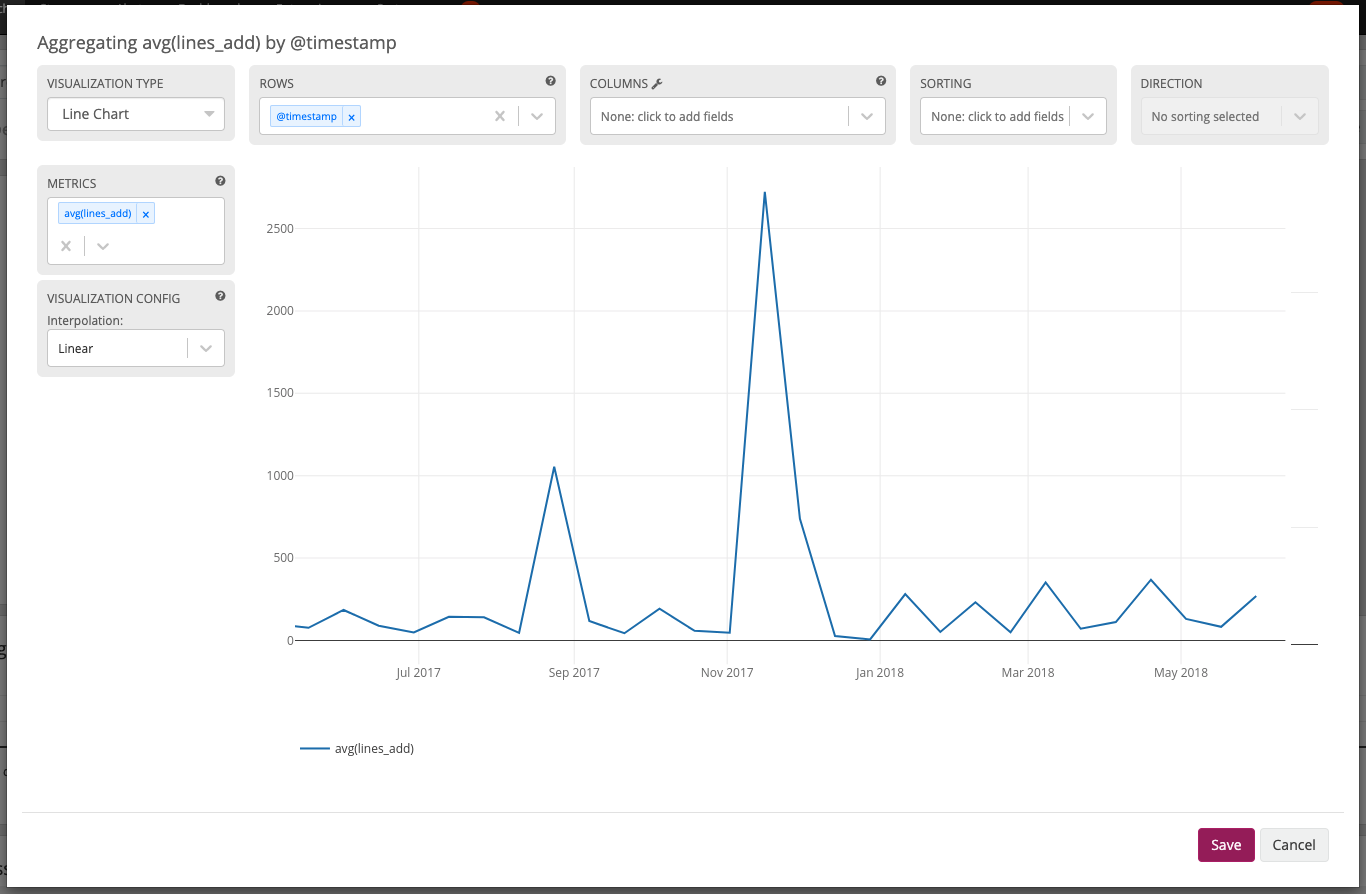
- METRICS
METRICS are a collection of functions to aggregate data points. The result of the aggregation depends on the grouping of ROWS and/or COLUMNS. The data points of a field will be aggregated to the grouping. Example The
avg()function will find the average of the numeric data pointstook_msaround the configured grouping.- ROWS/COLUMNS
Allows selecting fields whose values will be used to group results into new rows/columns. If the field is a
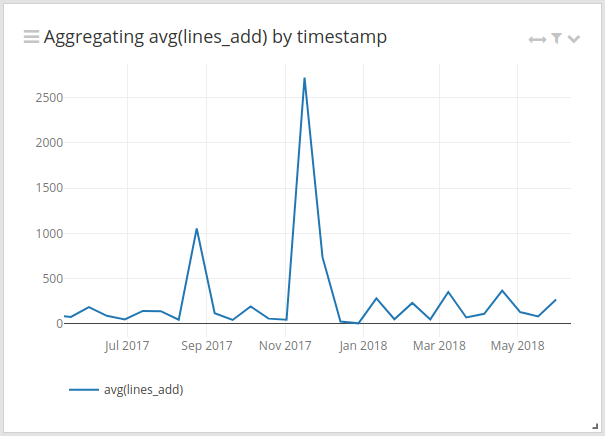
timestampfor a row it will divide the data points into intervals. Otherwise the aggregation will take by default up to 15 elements of the selected field and apply the selected METRICS function to the data points. Example Thetimestampfield is aggregated withavg()ontook_ms. The columnactionwill give the average loading time for a page per action for every 5 minutes.- VISUALIZATION
To display the result of an aggregation it is often easier to compare lots of result values graphically.
Area Chart,Bar Chart,Heatmap,Data Table,Line Chart,Pie Chart,Scatter Plot,Single NumberorWorld Mapcan be used as VISUALIZATION. TheWorld Mapneeds geographical points in the form oflatitude,longitude.- SORTING/DIRECTION
The order of the result values can be configured here. SORTING defines by which field the sorting should happen and DIRECTION configures if it will be
ascendingordescending.- INTERPOLATION
Visualizations like the
Area ChartandLine Chartsupport different interpolation types. The available interpolation types areLinear,Step-afterandSpline.- EVENT ANNOTATIONS
All viualizations which can display a timeline (
Area Chart,Bar chart,Line Chart,Scatter Plot) support event annotations. Each event will be displayed as an entry on the time axis.
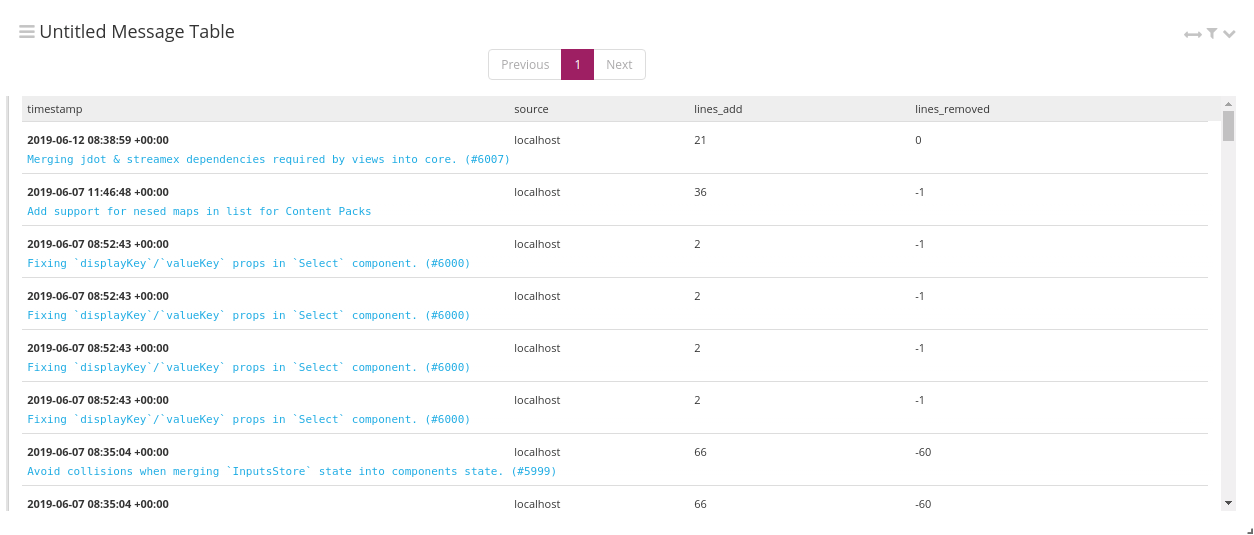
Message Table
The Message Table displays the messages and their fields. The Message Table can be configured to show the message fields and the actual message. The actual message is rendered in a blue font, below the fields. Clicking on a message row opens the detailed view of a message with all its fields.
Value and Field Actions
In the Sidebar and on Data Tables and Detail Message Rows are values and fields visible. By clicking on a value or a field a context menu will be shown where different actions can be executed.
Field actions
Based on the type of the field and where the menu is opened different Field actions are shown when a field name (and not its value) is clicked.
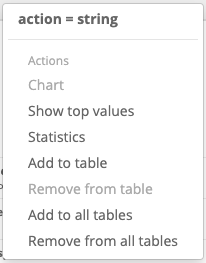
- Chart
This will generate a new Widget containing a line chart where the fields average value is displayed over time. This chart can be taken as an starting point for a more defined aggregation. This is only possible on fields from a numerical type.
- Show top values
This action will generate a new Widget containing a data table where the fields value are listed in the rows and the count of occurrence will be displayed next to it. This was formerly known as the “Quick Values” action.
- Statistics
Here the field values will be given to various statistics function depending on the type of the field. The result will be displayed in a Data Table Widget.
- Add to table
Add the field to the displayed fields of the message table where the Field Actions menu is shown.
- Add to all tables
Add the field to the displayed fields of all tables.
- Remove from table
Remove the field from the list displayed fields from this table.
- Remove from all tables
Remove the field from the list displayed fields from all tables.
Value actions
The value actions produce different results depending on the type of the value and where the menu is opened. The following actions can be executed.
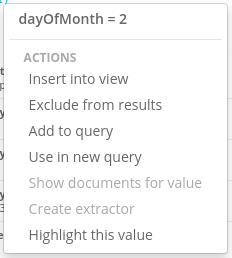
- Insert into view
This action will open up a modal where a view can be selected. A select-able list of Parameters will be shown from the selected view and after choosing a parameter a new browser tab will be opened containing the view with the value used in the parameter. This action is only available in enterprise Graylog.
- Exclude from results
Will add NOT field:value to the query to exclude all results where the field contains the value of the value action.
- Add to query
Will add field:value to the query to filter the results additionally for where the field has the value of the value action.
- Use in new query
Will open a new view tab with field:value as query string.
- Show documents for value
Available in Data Tables it will show the documents which where aggregated to display this value.
- Create extractor
For values of type string in Message Tables a short cut to create an extractor is given with this action.
- Highlight this value
This action will highlight this value for this field in all Message Tables and Data Tables.
Repositioning and Resizing
Widgets can be freely placed inside the search result grid. You can drag and drop them with the three lines left to the widget name or you resize them by using the gray arrow in their bottom-right corner. To expand a widget to the full grid width, click on the arrow in its top-right corner.